













A man observing the market through the charts. Source: TechGaged / Shutterstock.
HYPE Liquidation Imbalance Favors the Upside — But One Level Could Change Everything
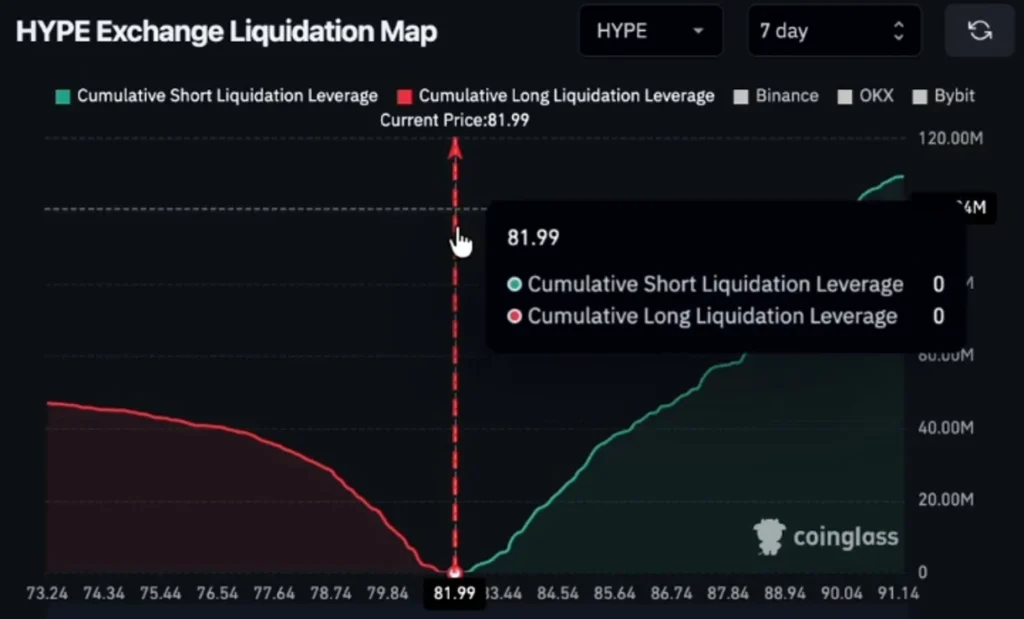
HYPE’s liquidation imbalance favors the upside. The Coinglass seven-day map shows about $100M in short liquidations above $90.
It shows only about $44M in long liquidations below $75. That is more than twice the upside volume. One level still decides how this plays out.
What Does the Liquidation Map Show?
A liquidation map estimates where leveraged traders would be forced out of positions. The map was captured with HYPE at $81.99.
Latest Stories
XRP ETF Inflows Near $1.8B as Ripple Expands Global Partnerships

Arthur Hayes Moves Millions in ETH Again — But Why?

Bitcoin’s October 2026 Price Battle — Where Buyers and Sellers Could Take Control
On the left, long liquidation leverage grows as price falls toward $73. On the right, short liquidation leverage climbs steadily toward $91.
A rise above $90 could force shorts to buy back, which adds upward pressure. Demand across crypto has cooled, as Bitcoin ETF inflows collapsed 88% in early October.
Is the Upside Edge Real?
The imbalance is real, but distance matters. At $80.15, HYPE sits about 6.4% above $75. The $90 cluster is about 12.3% away. The smaller long cluster is therefore much closer.
Longs already took the hit on 13 October, when 98.2% of about $11.46M in HYPE liquidations were long positions.
The sell-off followed a hot inflation report, and Bitcoin was already defying two macro headwinds from the dollar and Treasury yields.
HYPE Slides 8.1% Toward the Map’s Edge
At 06:02 UTC on 15 October 2026, HYPE traded at $80.15. That is down 8.1% over seven days. The BTC pair stood at 0.00099236. The seven-day chart opens near $87 on 9 October.
Price dipped to about $83 that day, then recovered toward $86 by 10 October. HYPE held between $84 and $86 through 11 October and climbed to a peak near $88 on 12 October.
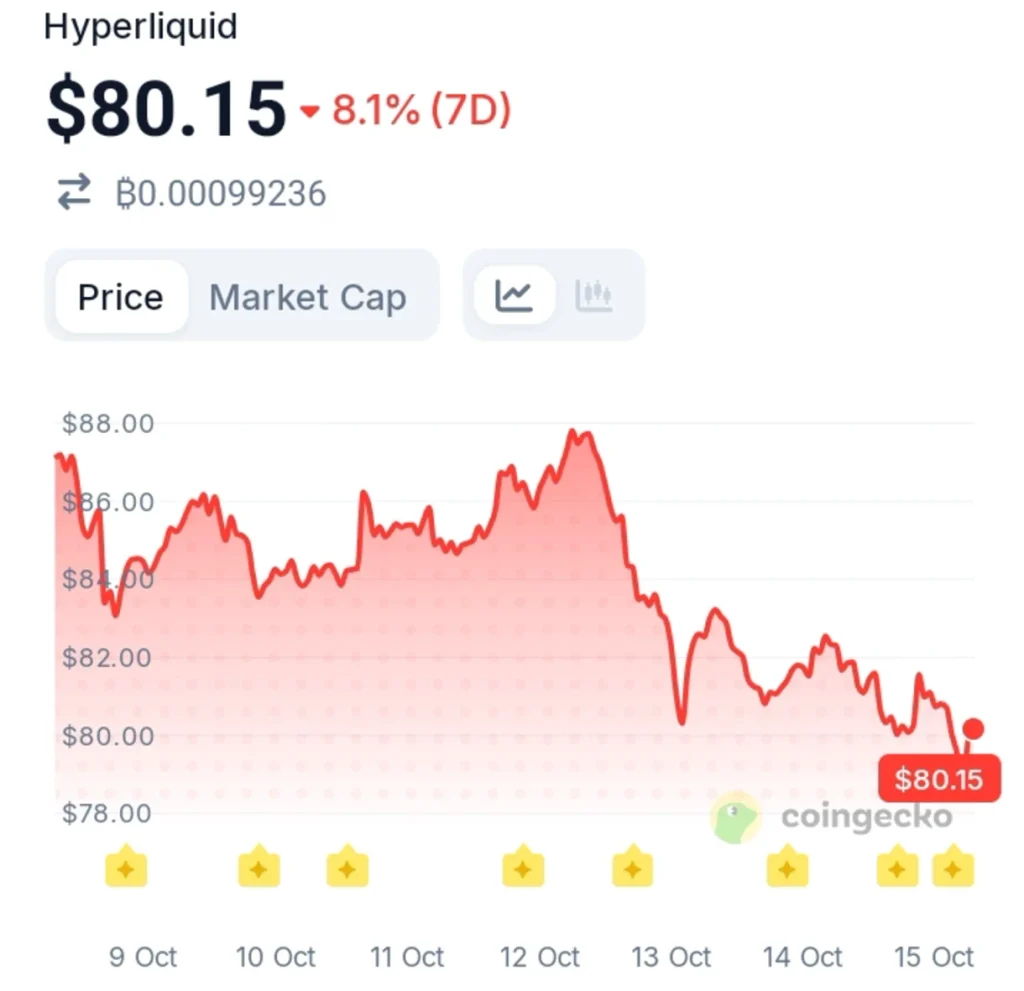
A sharp slide on 13 October took price to about $80.5. A bounce to about $83 faded, and price drifted lower through 14 October. HYPE touched about $80 early on 15 October.
The ecosystem is growing meanwhile, with tokenized stock markets arriving, though tokenized stocks carry hidden risks for investors.
Why $75 Matters More Than $90
Analysts say the setup comes down to about $75. Bulls who defend it could spark a sharp reversal. A loss of that level could turn sentiment bearish quickly.
Support near $79 to $79.50 sits in between. The map’s upside edge only counts if price survives the downside test first.
Disclaimer:
This article is for informational purposes only and does not constitute financial, investment, or trading advice. The views expressed are based on publicly available data, market observations, and the author’s interpretation at the time of writing. Cryptocurrency markets are highly volatile and unpredictable, and past performance or current technical setups do not guarantee future results. Readers should conduct their own research and consult with a qualified financial advisor before making any investment decisions. TechGaged does not accept liability for any losses incurred based on the information presented.
How do you rate this article?
Subscribe to our YouTube channel for crypto market insights and educational videos.






Join our Socials
Briefly, clearly and without noise – get the most important crypto news and market insights first.
Most Read Today
1
Bitcoin’s October 2026 Price Battle — Where Buyers and Sellers Could Take Control
2Solana Could Become the World’s Fastest Blockchain After This Upgrade
3More ETH Could Be Locked Away as Institutional Staking Access Expands
4A Major Solana Upgrade Targets High-Speed Agent Payments
5Clarity Act 2026: Everything You Should Know
Latest





8
Also read
Similar stories you might like.

Crypto News
Hyperliquid Opens Native Lending: HYPE and BTC Can Now Unlock More Liquidity
Azeez | 2026-09-19

Crypto News
Multicoin Capital Moves Millions More in HYPE — Is Selling Pressure Building?
Azeez | 2026-09-15

Crypto News
One HYPE Whale Has Been Selling for 2 Weeks — What Could Be Behind It?
Azeez | 2026-09-09

Crypto News
Multicoin Capital’s Latest HYPE Move Puts Sell Pressure in Focus
Azeez | 2026-09-02

Crypto News
This Mystery Whale Isn’t Done Buying HYPE
Azeez | 2026-08-30

Crypto News
AQAv2 Launch Could Boost HYPE Revenue by 18% and Fuel Buybacks
Azeez | 2026-08-27

Crypto News
Hyperliquid to the U.S. — What Does CZ Really See?
Azeez | 2026-08-21

Crypto News
Hyperliquid Removes A Costly Barrier To Its Data: What Could This Mean For HYPE?
Azeez | 2026-08-14

Crypto News
Wall Street-Style Capital Enters DeFi: Bitwise Stakes Millions in HYPE
Azeez | 2026-06-28
Crypto News
Some Crypto Protocols Trade At Just 1x Revenue – Grayscale
Rokas | 2026-06-25